XR encompasses Mixed Reality, Spatial Computing, Virtual & Augmented Reality and even holographic displays. While completely optional, these add surprising benefits outlined below. Immersion Analytics supports leading platforms including Apple Vision Pro, HTC Vive e.g. XR Elite, Microsoft HoloLens 2 and Meta Quest (v2 and above). We also support the world’s first autostereoscopic laptop, the zSpace Inspire (holograms floating over your keyboard, no glasses).
An obvious benefit of such devices is for engaging audiences with rich content. Captivate attention at your next conference by having your audience wear Virtual Reality which prevents them from viewing their smartphones and offers a memorable experience. Now imagine presenting to a group of participants — in person or remotely — each wearing an inexpensive VR headset. Not only is your content more engaging, it also becomes physically impossible for participants to get distracted from your message. Immersion Analytics fully supports and enables this use case.
While such devices are not required to gain dimensional perspective using the Immersion Analytics technology, there are added benefits worth considering. After all, the visual cortex did evolve over millions of years to process information spatially. As Dr. David Williams of University of Rochester points out, “More than 50 percent of the cortex, the surface of the brain, is devoted to processing visual information.” This helps explain why data visualization hands-on in XR is profoundly more engaging than trapping your audience in the flatland of charts and graphs presented on 2D surfaces. Data visualization pioneer and Yale University professor emeritus Edward Tufte’s work “Escaping Flatland” and single-day class has inspired much of what we do here at Immersion Analytics.
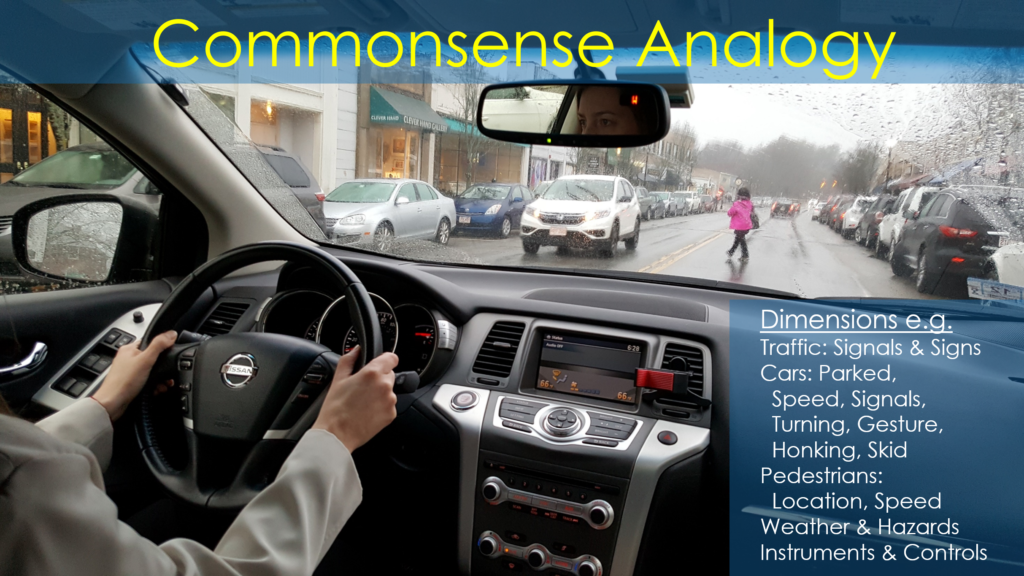
Human success with real-time activities such as driving cars, flying aircraft and even walking offers commonsense evidence that you are indeed capable of perceiving & coping with many dimensions in real-time,

Consider the everyday activity of driving a car. Driving, you naturally attend to the correct anomalies in real-time across dimensions including each cars’ position, size, speed, direction, signal, brake lights, backup lights, driver gesture, horn, possible smoke / mechanical failure cues etc. all while attending to traffic signals and signs, pedestrians, gauges, controls. When the left tail light of a car in traffic comes on solid without the right light, you know that car is braking (not turning) and has a burnt out tail light on the right. And when a pedestrian steps into traffic, you handle that smoothly too. This is why you already process far more simultaneous dimensions than Immersion Analytics proposes, intuitively attending to what matters while ignoring the rest.
This explains why XR is so powerful bringing people closer to understanding big data. As far back as 1994, Ware & Franck published the following research demonstrating that viewing a network graph even in VR as available at that time was three times as good as the flat display. Specifically, they found that users are able to achieve the same task efficacy with 3x as many data points immersively vs. what’s possible via traditional 2D displays. Our production experience echoes their findings,
source: https://scholars.unh.edu/cgi/viewcontent.cgi?httpsredir=1&article=1181&context=ccom
All this said, words are poor substitute for experiencing Immersion Analytics in an XR device for yourself. Contact us to learn more about our software, consulting & onsite events.
